什么是 Vagrant
Vagrant 是一种开源软件产品,用来方便构建和维护虚拟软件开发环境。
例如,它可以基于 VirtualBox、VMware、KVM、Hyper-V 和 AWS 甚至是 Docker 等提供商来构建开发环境。它通过简化虚拟化的软件配置管理,来提高开发效率。
Vagrant 是用 Ruby 语言开发的,但它的生态系统支持使用其他几种语言进行开发。
简单来说 Vagrant 是对传统虚拟机的一层封装,能够让你更方便的使用虚拟开发环境。
Go 是一种开源编程语言,可以轻松构建简单、可靠和高效的软件。
先问一个大多数人可能会忽略的问题:Google 的这门开源编程语言叫 Go 还是 Golang?还是两个都行?给你三秒钟想一下 …
Google 说:它叫 Go。之所以有人称它为 Golang 是由于之前的 Go 语言官网是 golang.org(因为 go.org 已经被别人用了),因此有人将 Golang 和 Go 混用了。
现在输入 golang.org 会直接跳转到 go.dev 这个网址,这也算是彻底给自家孩子正个名。
官网是这样介绍 Go 语言的:
今天,Go 被用于各种应用程序:
本篇分享在编写 Dockerfiles 和使用 Docker 时应遵循的一些最佳实践。篇幅较长,建议先收藏慢慢看,保证看完会很有收获。
Dockerfile 最佳实践
COPY 而不是 ADDPython 包缓存到 Docker 主机上ENTRYPOINT 和 CMD 之间的区别HEALTHCHECKDocker 镜像最佳实践
.dockerignore 文件利用多阶段构建的优势来创建更精简、更安全的Docker镜像。多阶段 Docker 构建(multi-stage builds)允许你将你的 Dockerfile 分成几个阶段。
例如,你可以有一个阶段用于编译和构建你的应用程序,然后可以复制到后续阶段。由于只有最后一个阶段被用来创建镜像,与构建应用程序相关的依赖关系和工具就会被丢弃,因此可以留下一个精简的、模块化的、可用于生产的镜像。
Web 开发示例:
工作十几年用过了不少显示器,从最初的 17寸,到后来的 23寸、27寸、32寸、再到现在的 34 寸,根据我自己的使用体验,来个主观推荐:
第一名,一个34寸曲面显示器
第二名,一个27寸 + 一个23寸的双屏组合
第三名,一个32寸 + 一个23寸的双屏组合
第三名,两个 23 寸的双屏组合(并列第三名)
以上这些屏幕推荐购买 2K 及以上的分辨率,1080p 的分辨率不推荐。
下面我就按照时间轴说说我用过的那些显示器。
最近实现了一个很有意思的 Workflow,就是通过 GitHub Actions 自动将每次最新发布的文章自动同步到我的 GitHub 首页。
就像这样在首页显示最近发布的博客文章。
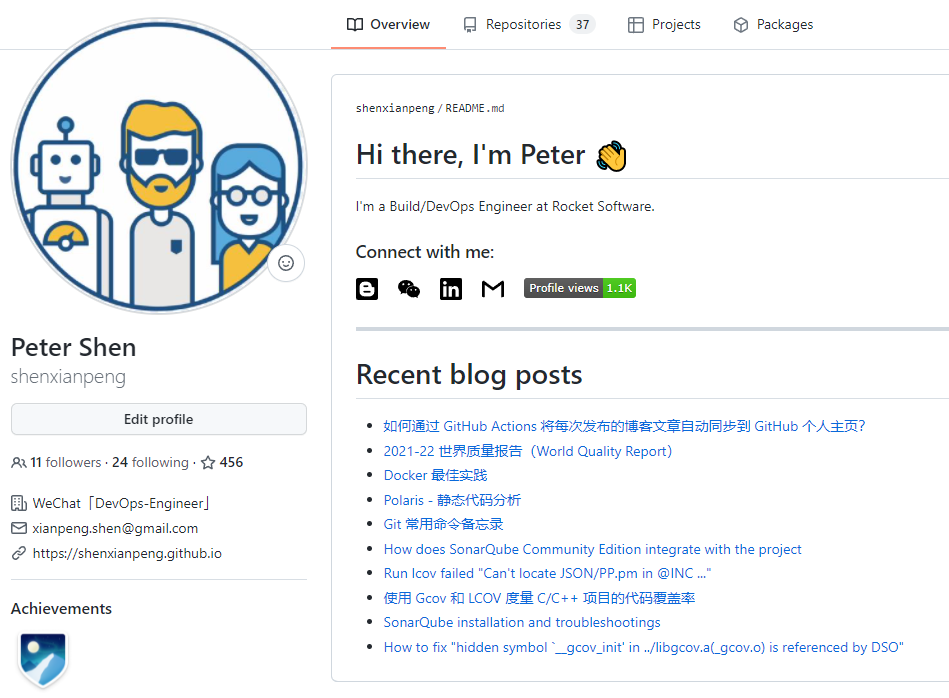
要实现这样的工作流需要了解以下这几点:
README.md 信息会显示在首页README.md2021-22 世界质量报告(World Quality Report 简称 WQR)是由 Micro Focus,Capgemini 和 Sogeti 三家公司合作的来分析软件质量和测试趋势在全球范围内唯一的报告。
这份报告共采访了 1750 名高管和专业人士。从最高管理层到 QA 测试经理和质量工程师,涵盖了来自全球 32 个国家的 10 个行业。
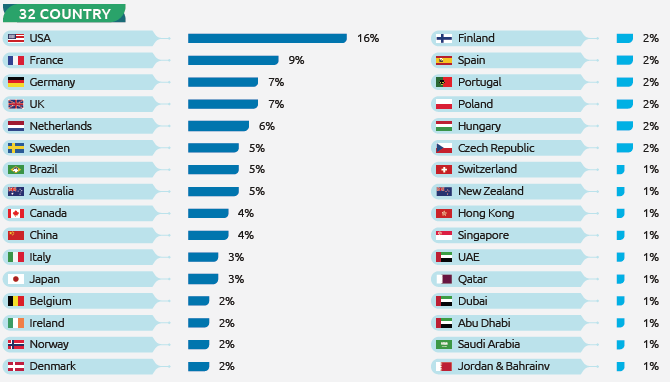
世界质量报告(WQR)是一项独一无二的全球研究,今年的调查强调了新部署方法中不断变化的受大流行影响的应用程序需求的影响,以及 QA 对敏捷和 DevOps 实践的采用,AI 的持续增长。
作为测试关注这类软件质量报告可以帮助我们快速了解软件测试行业的现状和趋势。
WQR 的一个关键信息:在新冠疫情依旧的今天,我们看到了数字化转型的融合以及敏捷和 DevOps 实践的实时采用。此外,QA 正在成为采用敏捷和 DevOps 实践的领导者,为团队提供工具和流程以促进整个软件生命周期(SDLC)的质量。
WQR 围绕关键发现和趋势突出了五个特定主题:
这可能是中文网里介绍Polaris最详细的文章了
Polaris - 托管静态应用程序软件测试(SAST)工具的 SaaS 平台,它是用于分类和修复漏洞并运行报告的 Web 站点。
SAST - 一种对源代码分析或构建过程中去寻找安全漏洞的工具,是一种在软件开发的生命周期(SDLC)中确保安全的重要步骤。
Coverity - Coverity 是 Synopsys 公司提供的原始静态应用软件测试 (SAST) 工具。Polaris 是 Coverity 的 SaaS 版本。
Synopsys - 是开发 Polaris 和其他软件扫描工具的公司,比如 BlackDuck 也是他们的产品。
C/C++ |
通常如果你的组织引入了 Polaris 的 SaaS 服务,你将会有如下网址可供访问 URL: https://organization.polaris.synopsys.com
然后登录,你就可以给自己的 Git Repository 创建对应的项目了。
建议:创建的项目名称与 Git Repository 的名称一致。
在进行 Polaris 扫描之前,你需要先下载并安装 polaris。
如果你的 Polaris server URL 为:POLARIS_SERVER_URL=https://organization.polaris.synopsys.com
下载连接为:$POLARIS_SERVER_URL/api/tools/polaris_cli-linux64.zip
然后将下载到本地的 polaris_cli-linux64.zip 进行解压,将其 bin 目录添加到 PATH 中。
在进行扫描之前,你需要为你的项目创建 YAML 文件。默认配置文件名为 polaris.yml,位于项目根目录。如果你希望指定不同的配置文件名,你可以在 polaris 命令中使用 -c 选项。
在项目根目录运行 polaris setup 以生成通用的 polaris.yml 文件。
运行 polaris configure 以确认你的文件在语法上是正确的并且 polaris 没有任何问题。
YAML 配置文件可以包含三种类型的 Capture:
| Languages | Build Options |
|---|---|
| C, C++, ObjectiveC, Objective C++,Go, Scala, Swift | 使用 Build 捕获 |
| PHP, Python, Ruby | 使用 Buildless 或 Filesystem 捕获 |
| C#, Visual Basic. | 如果想获得更准确的结果使用 Build 捕获;如果寻求简单使用 Buildless 捕获 |
| Java | 如果想获得更准确的结果使用 Build 捕获;如果寻求简单使用 Buildless 捕获 |
| JavaScript,TypeScript | 使用 Filesystem 捕获;如果寻求简单使用 Buildless 捕获 |
如果你正在扫描 C/C++ 代码,则应包括此分析部分以充分利用 Polaris 的扫描功能:
analyze: |
After you have set up the SonarQube instance, you will need to integrate SonarQube with project.
Because I used the community edition version, it doesn’t support the C/C++ project, so I only demo how to integrate with Maven, Gradle, and Others.
For example, the demo project name and ID in SonarQube are both test-demo, and I build with Jenkins.
When execute command: lcov --capture --directory . --no-external --output-file coverage.info to generate code coverage report, I encountered the following error:
$ lcov --capture --directory . --no-external --output-file coverage.info |
本篇分享如何使用 Gcov 和 LCOV 对 C/C++ 项目进行代码覆盖率的度量。
如果你想了解代码覆盖率工具 Gcov 是如何工作的,或是以后需要做 C/C++ 项目的代码覆盖率,希望本篇对你有所帮助。
In my opinion, SonarQube is not a very easy setup DevOps tool to compare with Jenkins, Artifactory. You can’t just run some script under the bin folder to let the server boot up.
You must have an installed database, configuration LDAP in the config file, etc.
So I’d like to document some important steps for myself, like setup LDAP or PostgreSQL when I install SonarQube of v9.0.1. It would be better if it can help others.
Need to be installed JRE/JDK 11 on the running machine.
Here is the prerequisites overview: https://docs.sonarqube.org/latest/requirements/requirements/
Download SonarQube: https://www.sonarqube.org/downloads/
cd sonarqube/ |
I installed SonarQube on CentOS 7 machine, the Java version is OpenJDK 1.8.0_242 by default, but the prerequisite shows at least need JDK 11. There is also JDK 11 available on my machine, so I just need to change the Java version.
I recommend using the alternatives command change Java version,refer as following:
$ java -version |
SonarQube needs you to have installed a database. It supports several database engines, like Microsoft SQL Server, Oracle, and PostgreSQL. Since PostgreSQL is open source, light, and easy to install, so I choose PostgreSQL as its database.
How to download and install PostgreSQL please see this page: https://www.postgresql.org/download/linux/redhat/
Please refer to the sonar.properties file at the end of this post.
sonar.security.realm=LDAP |
Comment out ldap.followReferrals=false in sonar.properties file would be help.
Related post: https://community.sonarsource.com/t/ldap-login-takes-2-minutes-the-first-time/1573/7
I want to display Javascript code coverage result in SonarQube, so I added sonar.javascript.lcov.reportPaths=coverage/lcov.info to the sonar-project.properties
But when I run sonar-scanner.bat in the command line, the code coverage result can not show in sonar. I noticed the following error from the output:
INFO: Analysing [C:\workspace\xvm-ide\client\coverage\lcov.info] |
There are some posts related to this problem, for example, https://github.com/kulshekhar/ts-jest/issues/542, but no one works in my case.
# here is an example error path in lcov.info |
Finally, I have to use the sed command to remove ..\ in front of the paths before running sonar-scanner.bat, then the problem was solved.
sed -i 's/\..\\//g' lcov.info |
Please comment if you can solve the problem with changing options in the tsconfig.json file.
To output more logs, change sonar.log.level=INFO to sonar.log.level=DEBUG in below.
Note: all above changes of
sonar.propertiesneed to restart the SonarQube instance to take effect.
sonar.propertiesFor the sonar.properties file, please see below or link
When you want to add build status to your Bitbucket the specific commit of a branch when you start a build from the branch
When the build status is wrong, you want to update it manually. for example, update build status from FAILED to SUCCESSFUL
You can call Bitbucket REST API to do these.
Below is the code snippet to update Bitbucket build status with REST API in the shell script.
The code on GitHub Gist: https://gist.github.com/shenxianpeng/bd5eddc5fb39e54110afb8e2e7a6c4fb
Click Read More to view the code here.