Record JMeter Scripts
use JMeter’s HTTP(S) Test Script Recorder, please refer to this official document https://jmeter.apache.org/usermanual/jmeter_proxy_step_by_step.html
Running JMeter Scripts
Debug scripts on JMeter in GUI Mode
You can debug your record scripts in GUI Mode until there are no errors
run test scripts in Non-GUI Mode(Command Line mode) recommend
jmeter -n -t ..\extras\Test.jmx -l Test.jtl
Running JMeter Scripts on Jenkins
Need Tools
- Jmeter - Web Request Load Testing
- Jmeter-plugins
- ServerAgent-2.2.1 - PerfMon Agent to use with Standard Set
Test server
Two virtual machines
- System under test
- Jmeter execution machine, this server is also Jenkins server
Implement
Develop test script
Record Scripts - use JMeter’s HTTP(S) Test Script Recorder, please refer to this official document https://jmeter.apache.org/usermanual/jmeter_proxy_step_by_step.html
Create Jenkins job for running JMeter scripts
Create a new item->select Freestyle project
Add build step->Execute Windows batch command
//access to jenkins jobs workspace, empty the last test results
cmd
cd C:\Users\peter\.jenkins\jobs\TEST-122 Upload large data\workspace
del /Q "jtl"\*
del /Q "PerfMon Metrics Collector"\*
Add build step->Execute Windows batch command
//add first run jmeter script command, if you want run others script you can continue to add "Execute Windows batch command"
jmeter -n -t script/UploadLargeData-1.jmx -l jtl/UploadLargeData-1.jtl
Configure build email - Configure System
//Configure System, Extended E-mail Notification
SMTP server: smtp.gmail.com

//Job Configure, Enable "Editable Email Notification"
Project Recipient List: xianpeng.shen@gmail.com
Project Reply-To List: $DEFAULT_REPLYTO
Content Type: HTML (text/html)
Default Subject:$DEFAULT_SUBJECT
Default Content: ${SCRIPT, template="groovy-html.template"}

//Advance setting
Triggers: Always
          Send to Recipient List
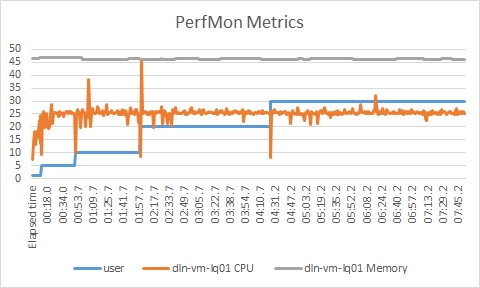
Generate test report
JMeter->Add listener->add jp@gc - PerfMon Metrics Collector, browse Test.jtl, click right key on graph Export to CSV
Analyze test results
Introduction test scenarios
Using 1, 5, 10, 20, 30, (50) users loading test, record every group user test results
Glossary
- Sample(label) - This indicates the number of virtual users per request.
- Average - It is the average time taken by all the samples to execute specific label
- Median - is a number which divides the samples into two equal halves.
- %_line - is the value below which 90, 95, 99% of the samples fall.
- Min - The shortest time taken by a sample for specific label.
- Max - The longest time taken by a sample for specific label.
- Error% - percentage of failed tests.
- Throughput - how many requests per second does your server handle. Larger is better.
- KB/Sec - it is the Throughput measured in Kilobytes per second.
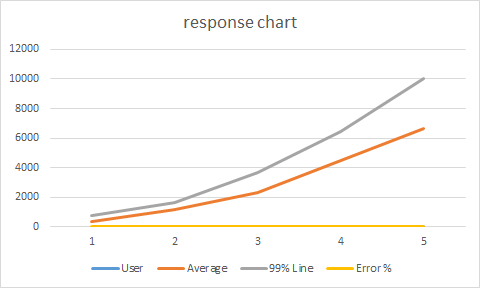
Example: Test results of each scenario shown in the following table
| User | # Samples | Average | Median | 90% Line | 95% LIne | Min | Max | Error % | Throughput | Received | Send KB/sec |
|---|---|---|---|---|---|---|---|---|---|---|---|
| 1 | 31 | 348 | 345 | 452 | 517 | 773 | 5 | 773 | 0.00% | 2.85215 | 2.5 |
| 5 | 155 | 1166 | 1164 | 1414 | 1602 | 1639 | 9 | 1821 | 0.00% | 4.26445 | 3.73 |
| 10 | 310 | 2275 | 2299 | 2687 | 2954 | 3671 | 20 | 4104 | 0.00% | 4.38547 | 3.84 |
| 20 | 620 | 4479 | 4620 | 5113 | 6152 | 6435 | 39 | 6571 | 0.00% | 4.42826 | 3.88 |
| 30 | 930 | 6652 | 6899 | 7488 | 9552 | 10051 | 4 | 10060 | 0.00% | 4.46776 | 3.91 |
Test results analysis chart