Record JMeter Scripts#
use JMeter’s HTTP(S) Test Script Recorder, please refer to this official document https://jmeter.apache.org/usermanual/jmeter_proxy_step_by_step.html
Running JMeter Scripts#
Debug scripts on JMeter in GUI Mode
You can debug your record scripts in GUI Mode until there are no errors
run test scripts in Non-GUI Mode(Command Line mode) recommend
jmeter -n -t ..\extras\Test.jmx -l Test.jtl
Running JMeter Scripts on Jenkins#
Need Tools#
- Jmeter - Web Request Load Testing
- Jmeter-plugins
- ServerAgent-2.2.1 - PerfMon Agent to use with Standard Set
Test server#
Two virtual machines
- System under test
- Jmeter execution machine, this server is also Jenkins server
Implement#
Develop test script#
Record Scripts - use JMeter’s HTTP(S) Test Script Recorder, please refer to this official document https://jmeter.apache.org/usermanual/jmeter_proxy_step_by_step.html
Create Jenkins job for running JMeter scripts#
Create a new item->select Freestyle project
Add build step->Execute Windows batch command
//access to jenkins jobs workspace, empty the last test results
cmd
cd C:\Users\peter\.jenkins\jobs\TEST-122 Upload large data\workspace
del /Q "jtl"\*
del /Q "PerfMon Metrics Collector"\*
Add build step->Execute Windows batch command
//add first run jmeter script command, if you want run others script you can continue to add "Execute Windows batch command"
jmeter -n -t script/UploadLargeData-1.jmx -l jtl/UploadLargeData-1.jtl
Configure build email - Configure System
//Configure System, Extended E-mail Notification
SMTP server: smtp.gmail.com

//Job Configure, Enable "Editable Email Notification"
Project Recipient List: xianpeng.shen@gmail.com
Project Reply-To List: $DEFAULT_REPLYTO
Content Type: HTML (text/html)
Default Subject:$DEFAULT_SUBJECT
Default Content: ${SCRIPT, template="groovy-html.template"}

//Advance setting
Triggers: Always
          Send to Recipient List
Generate test report#
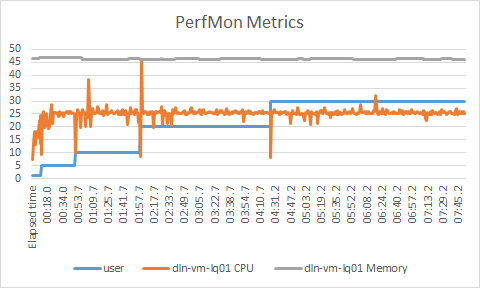
JMeter->Add listener->add jp@gc - PerfMon Metrics Collector, browse Test.jtl, click right key on graph Export to CSV
Analyze test results#
Introduction test scenarios
Using 1, 5, 10, 20, 30, (50) users loading test, record every group user test results
Glossary
- Sample(label) - This indicates the number of virtual users per request.
- Average - It is the average time taken by all the samples to execute specific label
- Median - is a number which divides the samples into two equal halves.
- %_line - is the value below which 90, 95, 99% of the samples fall.
- Min - The shortest time taken by a sample for specific label.
- Max - The longest time taken by a sample for specific label.
- Error% - percentage of failed tests.
- Throughput - how many requests per second does your server handle. Larger is better.
- KB/Sec - it is the Throughput measured in Kilobytes per second.
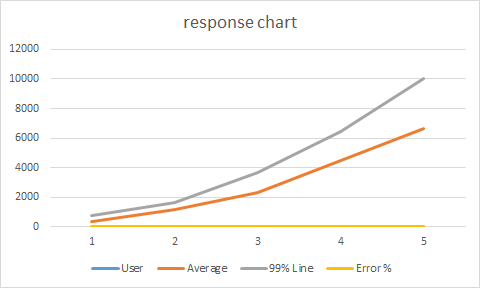
Example: Test results of each scenario shown in the following table
| User | # Samples | Average | Median | 90% Line | 95% LIne | Min | Max | Error % | Throughput | Received | Send KB/sec |
|---|---|---|---|---|---|---|---|---|---|---|---|
| 1 | 31 | 348 | 345 | 452 | 517 | 773 | 5 | 773 | 0.00% | 2.85215 | 2.5 |
| 5 | 155 | 1166 | 1164 | 1414 | 1602 | 1639 | 9 | 1821 | 0.00% | 4.26445 | 3.73 |
| 10 | 310 | 2275 | 2299 | 2687 | 2954 | 3671 | 20 | 4104 | 0.00% | 4.38547 | 3.84 |
| 20 | 620 | 4479 | 4620 | 5113 | 6152 | 6435 | 39 | 6571 | 0.00% | 4.42826 | 3.88 |
| 30 | 930 | 6652 | 6899 | 7488 | 9552 | 10051 | 4 | 10060 | 0.00% | 4.46776 | 3.91 |
Test results analysis chart