
This article shares how to use Gcov and LCOV to metrics code coverage for C/C++ projects. If you want to know how Gcov works, or you need to metrics code coverage for C/C++ projects later, I hope this article is useful to you.
Problems#
The problem I’m having: A C/C++ project from decades ago has no unit tests, only regression tests, but you want to know what code is tested by regression tests? Which code is untested? What is the code coverage? Where do I need to improve automated test cases in the future?
Can code coverage be measured without unit tests? Yes.
Code coverage tools for C/C++#
There are some tools on the market that can measure the code coverage of black-box testing, such as Squish Coco, Bullseye, etc. Their principle is to insert instrumentation when build product.
I’ve done some research on Squish Coco, because of some unresolved compilation issues that I didn’t buy a license for this expensive tool.
When I investigated code coverage again, I found out that GCC has a built-in code coverage tool called Gcov.
Prerequisites#
For those who want to use Gcov, to illustrate how it works, I have prepared a sample program that requires GCC and LCOV to be installed before running the program.
If you don’t have an environment or don’t want to install it, you can check out this example repository
Note: The source code is under the master branch master, and code coverage result html under branch coverage.
# This is the version of GCC and lcov on my test environment.
sh-4.2$ gcc --version
gcc (GCC) 4.8.5 20150623 (Red Hat 4.8.5-39)
Copyright (C) 2015 Free Software Foundation, Inc.
This is free software; see the source for copying conditions.  There is NO
warranty; not even for MERCHANTABILITY or FITNESS FOR A PARTICULAR PURPOSE.

sh-4.2$ lcov -v
lcov: LCOV version 1.14
How Gcov works#
Gcov workflow diagram
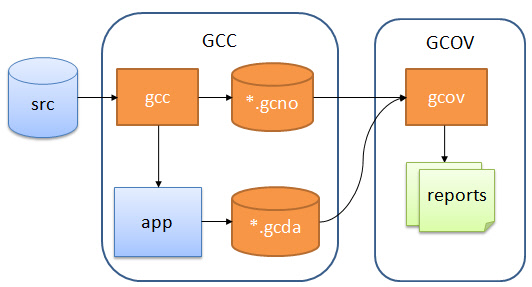
There are three main steps:
- Adding special compilation options to the GCC compilation to generate the executable, and
*.gcno. - Running (testing) the generated executable, which generates the
*.gcdadata file. - With
*.gcnoand*.gcda, generate thegcovfile from the source code, and finally generate the code coverage report.
Here’s how each of these steps is done exactly.
1. Compile#
The first step is to compile. The parameters and files used for compilation are already written in the makefile.
make build
Click to see the output of the make command
sh-4.2$ make build
gcc -fPIC -fprofile-arcs -ftest-coverage -c -Wall -Werror main.c
gcc -fPIC -fprofile-arcs -ftest-coverage -c -Wall -Werror foo.c
gcc -fPIC -fprofile-arcs -ftest-coverage -o main main.o foo.o
As you can see from the output, this program is compiled with two compile options -fprofile-arcs and -ftest-coverage.
After successful compilation, not only the main and .o files are generated, but also two .gcno files are generated.
The
.gcnorecord file is generated after adding the GCC compile option-ftest-coverage, which contains information for reconstructing the base block map and assigning source line numbers to blocks during the compilation process.
2. Running the executable#
After compilation, the executable main is generated, which is run (tested) as follows
./main
Click to see the output when running main
sh-4.2$ ./main
Start calling foo() ...
when num is equal to 1...
when num is equal to 2...
When main is run, the results are recorded in the .gcda data file, and if you look in the current directory,
you can see that two .gcda files have been generated.
$ ls
foo.c  foo.gcda  foo.gcno  foo.h  foo.o  img  main  main.c  main.gcda  main.gcno  main.o  makefile  README.md
.gcdarecord data files are generated because the program is compiled with the-fprofile-arcsoption introduced. It contains arc transition counts, value distribution counts, and some summary information.
3. Generating reports#
make report
Click to see the output of the generated report
sh-4.2$ make report
gcov main.c foo.c
File 'main.c'
Lines executed:100.00% of 5
Creating 'main.c.gcov'

File 'foo.c'
Lines executed:85.71% of 7
Creating 'foo.c.gcov'

Lines executed:91.67% of 12
lcov --capture --directory . --output-file coverage.info
Capturing coverage data from .
Found gcov version: 4.8.5
Scanning . for .gcda files ...
Found 2 data files in .
Processing foo.gcda
geninfo: WARNING: cannot find an entry for main.c.gcov in .gcno file, skipping file!
Processing main.gcda
Finished .info-file creation
genhtml coverage.info --output-directory out
Reading data file coverage.info
Found 2 entries.
Found common filename prefix "/workspace/coco"
Writing .css and .png files.
Generating output.
Processing file main.c
Processing file foo.c
Writing directory view page.
Overall coverage rate:
  lines......: 91.7% (11 of 12 lines)
  functions..: 100.0% (2 of 2 functions)
Executing make report to generate an HTML report actually performs two main steps behind this command.
With the
.gcnoand.gcdafiles generated at compile and run time, execute the commandgcov main.c foo.cto generate the.gcovcode coverage file.With the code coverage
.gcovfile, generate a visual code coverage report via LCOV.
The steps to generate the HTML result report are as follows.
# 1. Generate the coverage.info data file
lcov --capture --directory . --output-file coverage.info
# 2. Generate a report from this data file
genhtml coverage.info --output-directory out
Delete all generated files#
All the generated files can be removed by executing make clean command.
Click to see the output of the make clean command
sh-4.2$ make clean
rm -rf main *.o *.so *.gcno *.gcda *.gcov coverage.info out
Code coverage report#
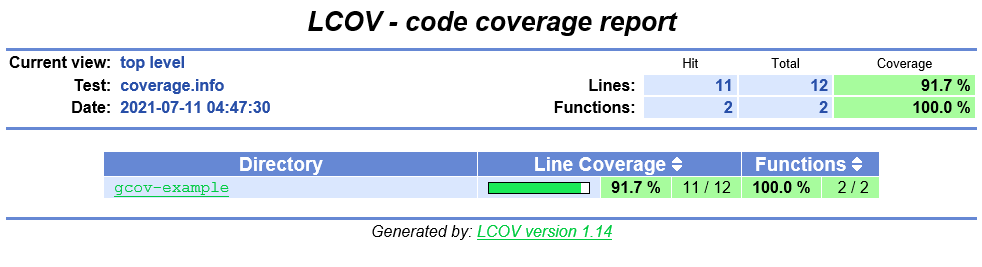
The home page is displayed in a directory structure
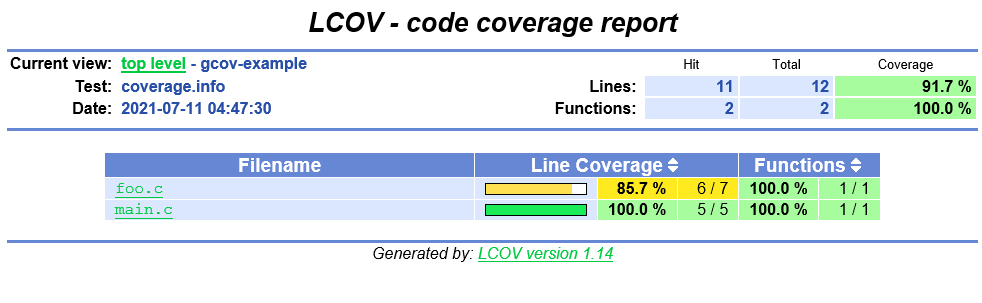
After entering the directory, the source files in that directory are displayed
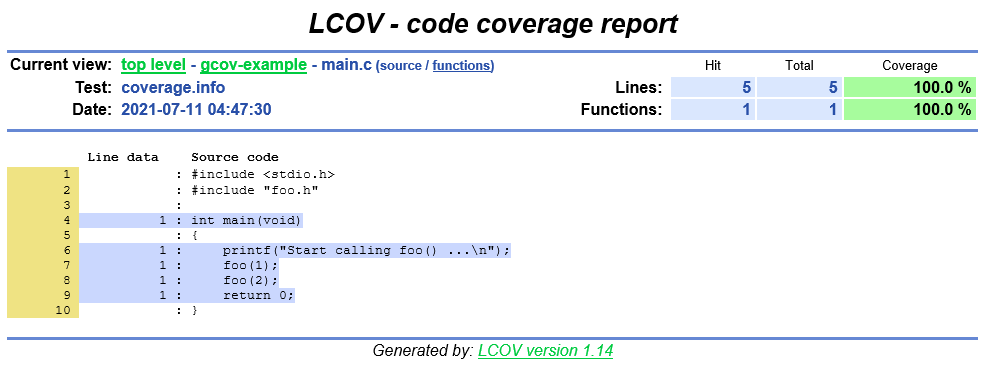
The blue color indicates that these statements are overwritten
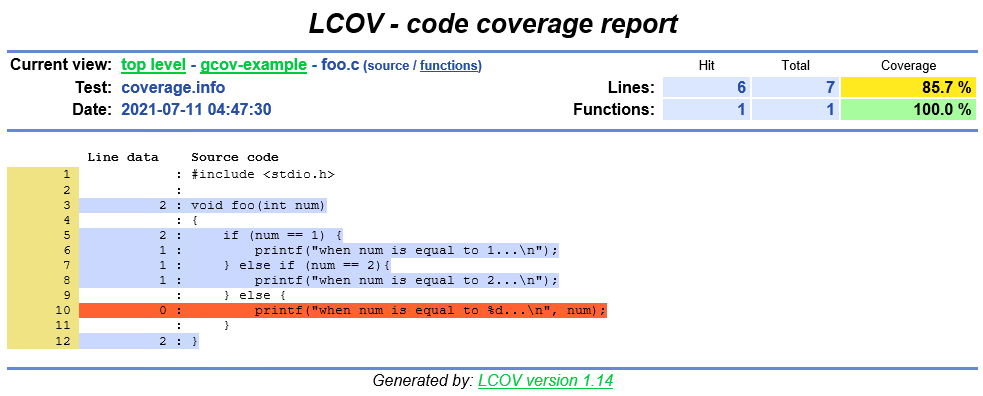
Red indicates statements that are not overridden
LCOV supports statement, function, and branch coverage metrics.
Side notes:
There is another tool for generating HTML reports called gcovr, developed in Python, whose reports are displayed slightly differently from LCOV. For example, LCOV displays it in a directory structure, while gcovr displays it in a file path, which is always the same as the code structure, so I prefer to use the former.